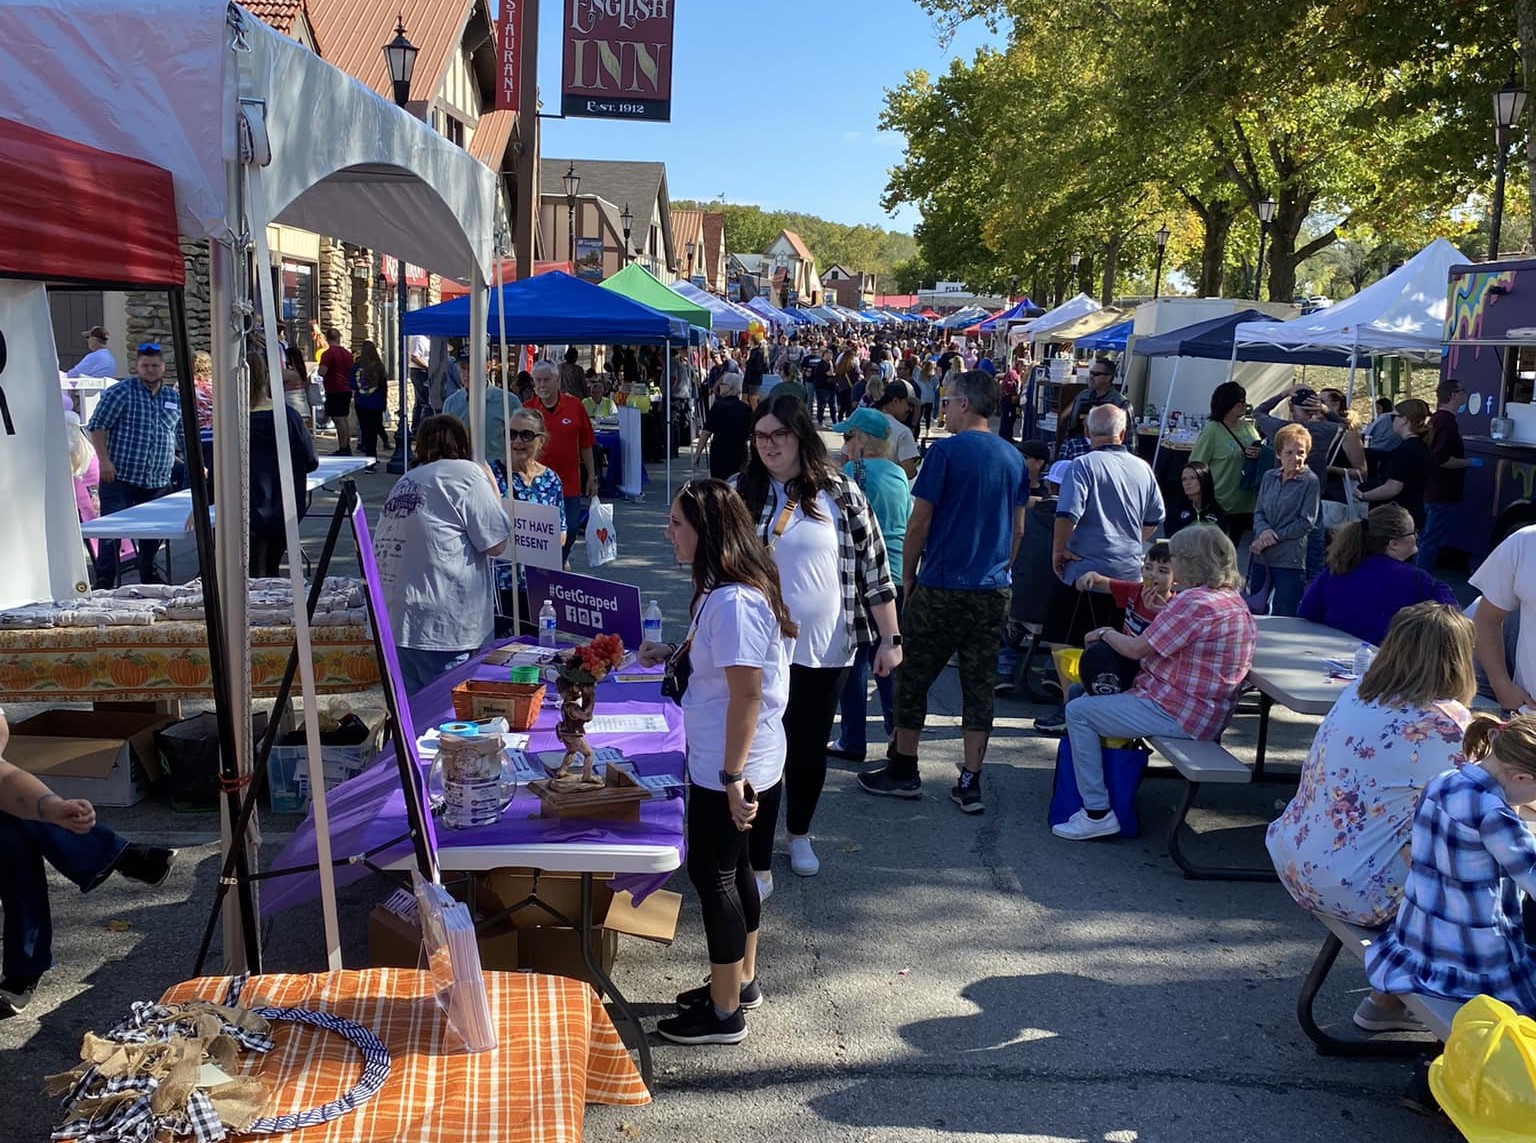
Page 1
Table DP-1. Profile of General Demographic Characteristics: 2000
Geographic area: Hollister city, Missouri
[For information on confidentiality protection, nonsampling error, and definitions, see text]
Subject
Number Percent
Total population. . . . . . . . . . . . . . . . . . . . . . . . . .
3,867
100.0
SEX AND AGE
Male . . . . . . . . . . . . . . . . . . . . . . . . . . . . . . . . . . . . . . . .
1,813
46.9
Female. . . . . . . . . . . . . . . . . . . . . . . . . . . . . . . . . . . . . .
2,054
53.1
Under 5 years . . . . . . . . . . . . . . . . . . . . . . . . . . . . . . .
263
6.8
5 to 9 years . . . . . . . . . . . . . . . . . . . . . . . . . . . . . . . . .
241
6.2
10 to 14 years . . . . . . . . . . . . . . . . . . . . . . . . . . . . . . .
216
5.6
15 to 19 years . . . . . . . . . . . . . . . . . . . . . . . . . . . . . . .
257
6.6
20 to 24 years . . . . . . . . . . . . . . . . . . . . . . . . . . . . . . .
383
9.9
25 to 34 years . . . . . . . . . . . . . . . . . . . . . . . . . . . . . . .
583
15.1
35 to 44 years . . . . . . . . . . . . . . . . . . . . . . . . . . . . . . .
542
14.0
45 to 54 years . . . . . . . . . . . . . . . . . . . . . . . . . . . . . . .
394
10.2
55 to 59 years . . . . . . . . . . . . . . . . . . . . . . . . . . . . . . .
193
5.0
60 to 64 years . . . . . . . . . . . . . . . . . . . . . . . . . . . . . . .
164
4.2
65 to 74 years . . . . . . . . . . . . . . . . . . . . . . . . . . . . . . .
315
8.1
75 to 84 years . . . . . . . . . . . . . . . . . . . . . . . . . . . . . . .
214
5.5
85 years and over . . . . . . . . . . . . . . . . . . . . . . . . . . . .
102
2.6
Median age (years). . . . . . . . . . . . . . . . . . . . . . . . . . .
34.8
(X)
18 years and over . . . . . . . . . . . . . . . . . . . . . . . . . . . .
2,992
77.4
Male . . . . . . . . . . . . . . . . . . . . . . . . . . . . . . . . . . . . . .
1,352
35.0
Female. . . . . . . . . . . . . . . . . . . . . . . . . . . . . . . . . . . .
1,640
42.4
21 years and over . . . . . . . . . . . . . . . . . . . . . . . . . . . .
2,817
72.8
62 years and over . . . . . . . . . . . . . . . . . . . . . . . . . . . .
740
19.1
65 years and over . . . . . . . . . . . . . . . . . . . . . . . . . . . .
631
16.3
Male . . . . . . . . . . . . . . . . . . . . . . . . . . . . . . . . . . . . . .
241
6.2
Female. . . . . . . . . . . . . . . . . . . . . . . . . . . . . . . . . . . .
390
10.1
RACE
One race . . . . . . . . . . . . . . . . . . . . . . . . . . . . . . . . . . . .
3,827
99.0
White . . . . . . . . . . . . . . . . . . . . . . . . . . . . . . . . . . . . .
3,733
96.5
Black or African American . . . . . . . . . . . . . . . . . . .
8
0.2
American Indian and Alaska Native. . . . . . . . . . .
44
1.1
Asian . . . . . . . . . . . . . . . . . . . . . . . . . . . . . . . . . . . . .
6
0.2
Asian Indian . . . . . . . . . . . . . . . . . . . . . . . . . . . . .
-
-
Chinese . . . . . . . . . . . . . . . . . . . . . . . . . . . . . . . . .
2
0.1
Filipino . . . . . . . . . . . . . . . . . . . . . . . . . . . . . . . . . .
4
0.1
Japanese. . . . . . . . . . . . . . . . . . . . . . . . . . . . . . . .
-
-
Korean. . . . . . . . . . . . . . . . . . . . . . . . . . . . . . . . . .
-
-
Vietnamese. . . . . . . . . . . . . . . . . . . . . . . . . . . . . .
-
-
Other Asian
1
. . . . . . . . . . . . . . . . . . . . . . . . . . . .
-
-
Native Hawaiian and Other Pacific Islander. . . .
6
0.2
Native Hawaiian. . . . . . . . . . . . . . . . . . . . . . . . . .
-
-
Guamanian or Chamorro . . . . . . . . . . . . . . . . . .
5
0.1
Samoan. . . . . . . . . . . . . . . . . . . . . . . . . . . . . . . . .
-
-
Other Pacific Islander
2
. . . . . . . . . . . . . . . . . . .
1
-
Some other race . . . . . . . . . . . . . . . . . . . . . . . . . . .
30
0.8
Two or more races . . . . . . . . . . . . . . . . . . . . . . . . . . .
40
1.0
Race alone or in combination with one
or more other races:
3
White . . . . . . . . . . . . . . . . . . . . . . . . . . . . . . . . . . . . . . .
3,773
97.6
Black or African American . . . . . . . . . . . . . . . . . . . . .
11
0.3
American Indian and Alaska Native. . . . . . . . . . . . .
72
1.9
Asian . . . . . . . . . . . . . . . . . . . . . . . . . . . . . . . . . . . . . . .
7
0.2
Native Hawaiian and Other Pacific Islander. . . . . .
6
0.2
Some other race . . . . . . . . . . . . . . . . . . . . . . . . . . . . .
39
1.0
Subject
Number Percent
HISPANIC OR LATINO AND RACE
Total population. . . . . . . . . . . . . . . . . . . . . . . . . .
3,867
100.0
Hispanic or Latino (of any race) . . . . . . . . . . . . . . . .
119
3.1
Mexican. . . . . . . . . . . . . . . . . . . . . . . . . . . . . . . . . . .
80
2.1
Puerto Rican. . . . . . . . . . . . . . . . . . . . . . . . . . . . . . .
6
0.2
Cuban . . . . . . . . . . . . . . . . . . . . . . . . . . . . . . . . . . . .
15
0.4
Other Hispanic or Latino . . . . . . . . . . . . . . . . . . . .
18
0.5
Not Hispanic or Latino . . . . . . . . . . . . . . . . . . . . . . . .
3,748
96.9
White alone. . . . . . . . . . . . . . . . . . . . . . . . . . . . . . . .
3,653
94.5
RELATIONSHIP
Total population. . . . . . . . . . . . . . . . . . . . . . . . . .
3,867
100.0
In households. . . . . . . . . . . . . . . . . . . . . . . . . . . . . . . .
3,755
97.1
Householder . . . . . . . . . . . . . . . . . . . . . . . . . . . . . . .
1,682
43.5
Spouse . . . . . . . . . . . . . . . . . . . . . . . . . . . . . . . . . . .
715
18.5
Child. . . . . . . . . . . . . . . . . . . . . . . . . . . . . . . . . . . . . .
933
24.1
Own child under 18 years . . . . . . . . . . . . . . . .
789
20.4
Other relatives . . . . . . . . . . . . . . . . . . . . . . . . . . . . .
149
3.9
Under 18 years . . . . . . . . . . . . . . . . . . . . . . . . .
59
1.5
Nonrelatives . . . . . . . . . . . . . . . . . . . . . . . . . . . . . . .
276
7.1
Unmarried partner. . . . . . . . . . . . . . . . . . . . . . .
108
2.8
In group quarters. . . . . . . . . . . . . . . . . . . . . . . . . . . . .
112
2.9
Institutionalized population. . . . . . . . . . . . . . . . . . .
112
2.9
Noninstitutionalized population . . . . . . . . . . . . . . .
-
-
HOUSEHOLD BY TYPE
Total households. . . . . . . . . . . . . . . . . . . . . . . . .
1,682
100.0
Family households (families). . . . . . . . . . . . . . . . . . .
1,005
59.8
With own children under 18 years . . . . . . . . . .
456
27.1
Married-couple family . . . . . . . . . . . . . . . . . . . . . . .
715
42.5
With own children under 18 years . . . . . . . . . .
264
15.7
Female householder, no husband present . . . . .
222
13.2
With own children under 18 years . . . . . . . . . .
154
9.2
Nonfamily households . . . . . . . . . . . . . . . . . . . . . . . .
677
40.2
Householder living alone . . . . . . . . . . . . . . . . . . . .
535
31.8
Householder 65 years and over . . . . . . . . . . . .
159
9.5
Households with individuals under 18 years . . . . .
507
30.1
Households with individuals 65 years and over . .
390
23.2
Average household size. . . . . . . . . . . . . . . . . . . . . . .
2.23
(X)
Average family size. . . . . . . . . . . . . . . . . . . . . . . . . . .
2.79
(X)
HOUSING OCCUPANCY
Total housing units. . . . . . . . . . . . . . . . . . . . . . .
1,931
100.0
Occupied housing units . . . . . . . . . . . . . . . . . . . . . . .
1,682
87.1
Vacant housing units. . . . . . . . . . . . . . . . . . . . . . . . . .
249
12.9
For seasonal, recreational, or
occasional use. . . . . . . . . . . . . . . . . . . . . . . . . . . .
70
3.6
Homeowner vacancy rate (percent). . . . . . . . . . . . .
4.6
(X)
Rental vacancy rate (percent). . . . . . . . . . . . . . . . . .
10.4
(X)
HOUSING TENURE
Occupied housing units . . . . . . . . . . . . . . . . . .
1,682
100.0
Owner-occupied housing units . . . . . . . . . . . . . . . . .
880
52.3
Renter-occupied housing units . . . . . . . . . . . . . . . . .
802
47.7
Average household size of owner-occupied units.
2.30
(X)
Average household size of renter-occupied units .
2.15
(X)
- Represents zero or rounds to zero.
(X) Not applicable.
1
Other Asian alone, or two or more Asian categories.
2
Other Pacific Islander alone, or two or more Native Hawaiian and Other Pacific Islander categories.
3
In combination with one or more of the other races listed. The six numbers may add to more than the total population and the six percentages
may add to more than 100 percent because individuals may report more than one race.
Source: U.S. Census Bureau, Census 2000.
U.S. Census Bureau
1

Page 2
Table DP-2. Profile of Selected Social Characteristics: 2000
Geographic area: Hollister city, Missouri
[Data based on a sample. For information on confidentiality protection, sampling error, nonsampling error, and definitions, see text]
Subject
Number Percent
SCHOOL ENROLLMENT
Population 3 years and over
enrolled in school. . . . . . . . . . . . . . . . . . . .
953
100.0
Nursery school, preschool . . . . . . . . . . . . . . . . . . . . .
89
9.3
Kindergarten. . . . . . . . . . . . . . . . . . . . . . . . . . . . . . . . .
77
8.1
Elementary school (grades 1-8) . . . . . . . . . . . . . . . .
373
39.1
High school (grades 9-12) . . . . . . . . . . . . . . . . . . . . .
210
22.0
College or graduate school . . . . . . . . . . . . . . . . . . . .
204
21.4
EDUCATIONAL ATTAINMENT
Population 25 years and over . . . . . . . . . .
2,510
100.0
Less than 9th grade . . . . . . . . . . . . . . . . . . . . . . . . . .
121
4.8
9th to 12th grade, no diploma. . . . . . . . . . . . . . . . . .
346
13.8
High school graduate (includes equivalency). . . . .
965
38.4
Some college, no degree. . . . . . . . . . . . . . . . . . . . . .
651
25.9
Associate degree. . . . . . . . . . . . . . . . . . . . . . . . . . . . .
126
5.0
Bachelor’s degree . . . . . . . . . . . . . . . . . . . . . . . . . . . .
223
8.9
Graduate or professional degree . . . . . . . . . . . . . . .
78
3.1
Percent high school graduate or higher . . . . . . . . .
81.4
(X)
Percent bachelor’s degree or higher . . . . . . . . . . . .
12.0
(X)
MARITAL STATUS
Population 15 years and over . . . . . . . . . .
3,175
100.0
Never married . . . . . . . . . . . . . . . . . . . . . . . . . . . . . . .
738
23.2
Now married, except separated . . . . . . . . . . . . . . . .
1,511
47.6
Separated . . . . . . . . . . . . . . . . . . . . . . . . . . . . . . . . . . .
64
2.0
Widowed . . . . . . . . . . . . . . . . . . . . . . . . . . . . . . . . . . . .
383
12.1
Female. . . . . . . . . . . . . . . . . . . . . . . . . . . . . . . . . . . .
284
8.9
Divorced . . . . . . . . . . . . . . . . . . . . . . . . . . . . . . . . . . . .
479
15.1
Female. . . . . . . . . . . . . . . . . . . . . . . . . . . . . . . . . . . .
306
9.6
GRANDPARENTS AS CAREGIVERS
Grandparent living in household with
one or more own grandchildren under
18 years . . . . . . . . . . . . . . . . . . . . . . . . . . . . .
45
100.0
Grandparent responsible for grandchildren . . . . . .
16
35.6
VETERAN STATUS
Civilian population 18 years and over . .
3,010
100.0
Civilian veterans . . . . . . . . . . . . . . . . . . . . . . . . . . . . .
463
15.4
DISABILITY STATUS OF THE CIVILIAN
NONINSTITUTIONALIZED POPULATION
Population 5 to 20 years. . . . . . . . . . . . . . .
803
100.0
With a disability . . . . . . . . . . . . . . . . . . . . . . . . . . . . . .
73
9.1
Population 21 to 64 years. . . . . . . . . . . . . .
2,332
100.0
With a disability . . . . . . . . . . . . . . . . . . . . . . . . . . . . . .
537
23.0
Percent employed . . . . . . . . . . . . . . . . . . . . . . . . . .
57.7
(X)
No disability . . . . . . . . . . . . . . . . . . . . . . . . . . . . . . . . .
1,795
77.0
Percent employed . . . . . . . . . . . . . . . . . . . . . . . . . .
77.3
(X)
Population 65 years and over . . . . . . . . . .
371
100.0
With a disability . . . . . . . . . . . . . . . . . . . . . . . . . . . . . .
142
38.3
RESIDENCE IN 1995
Population 5 years and over . . . . . . . . . . .
3,674
100.0
Same house in 1995. . . . . . . . . . . . . . . . . . . . . . . . . .
1,296
35.3
Different house in the U.S. in 1995 . . . . . . . . . . . . .
2,352
64.0
Same county . . . . . . . . . . . . . . . . . . . . . . . . . . . . . .
995
27.1
Different county . . . . . . . . . . . . . . . . . . . . . . . . . . . .
1,357
36.9
Same state . . . . . . . . . . . . . . . . . . . . . . . . . . . . . .
514
14.0
Different state. . . . . . . . . . . . . . . . . . . . . . . . . . . .
843
22.9
Elsewhere in 1995. . . . . . . . . . . . . . . . . . . . . . . . . . . .
26
0.7
Subject
Number Percent
NATIVITY AND PLACE OF BIRTH
Total population. . . . . . . . . . . . . . . . . . . . . . . . . .
3,951
100.0
Native. . . . . . . . . . . . . . . . . . . . . . . . . . . . . . . . . . . . . . .
3,847
97.4
Born in United States . . . . . . . . . . . . . . . . . . . . . . .
3,772
95.5
State of residence . . . . . . . . . . . . . . . . . . . . . . . .
1,510
38.2
Different state. . . . . . . . . . . . . . . . . . . . . . . . . . . .
2,262
57.3
Born outside United States . . . . . . . . . . . . . . . . . .
75
1.9
Foreign born. . . . . . . . . . . . . . . . . . . . . . . . . . . . . . . . .
104
2.6
Entered 1990 to March 2000 . . . . . . . . . . . . . .
25
0.6
Naturalized citizen. . . . . . . . . . . . . . . . . . . . . . . . . .
89
2.3
Not a citizen . . . . . . . . . . . . . . . . . . . . . . . . . . . . . . .
15
0.4
REGION OF BIRTH OF FOREIGN BORN
Total (excluding born at sea). . . . . . . . . . . . . .
104
100.0
Europe. . . . . . . . . . . . . . . . . . . . . . . . . . . . . . . . . . . . . .
42
40.4
Asia . . . . . . . . . . . . . . . . . . . . . . . . . . . . . . . . . . . . . . . .
9
8.7
Africa . . . . . . . . . . . . . . . . . . . . . . . . . . . . . . . . . . . . . . .
23
22.1
Oceania. . . . . . . . . . . . . . . . . . . . . . . . . . . . . . . . . . . . .
-
-
Latin America . . . . . . . . . . . . . . . . . . . . . . . . . . . . . . . .
30
28.8
Northern America. . . . . . . . . . . . . . . . . . . . . . . . . . . . .
-
-
LANGUAGE SPOKEN AT HOME
Population 5 years and over . . . . . . . . . . . . . .
3,674
100.0
English only . . . . . . . . . . . . . . . . . . . . . . . . . . . . . . . . .
3,509
95.5
Language other than English . . . . . . . . . . . . . . . . . .
165
4.5
Speak English less than very well. . . . . . . .
55
1.5
Spanish . . . . . . . . . . . . . . . . . . . . . . . . . . . . . . . . . . .
66
1.8
Speak English less than very well. . . . . . . .
28
0.8
Other Indo-European languages . . . . . . . . . . . . .
92
2.5
Speak English less than very well. . . . . . . .
20
0.5
Asian and Pacific Island languages. . . . . . . . . . .
7
0.2
Speak English less than very well. . . . . . . .
7
0.2
ANCESTRY (single or multiple)
Total population. . . . . . . . . . . . . . . . . . . . . . . . . .
3,951
100.0
Total ancestries reported . . . . . . . . . . . . . . . . . . .
3,366
85.2
Arab . . . . . . . . . . . . . . . . . . . . . . . . . . . . . . . . . . . . . . . .
-
-
Czech
1
. . . . . . . . . . . . . . . . . . . . . . . . . . . . . . . . . . . . . .
17
0.4
Danish . . . . . . . . . . . . . . . . . . . . . . . . . . . . . . . . . . . . . .
28
0.7
Dutch . . . . . . . . . . . . . . . . . . . . . . . . . . . . . . . . . . . . . . .
145
3.7
English. . . . . . . . . . . . . . . . . . . . . . . . . . . . . . . . . . . . . .
278
7.0
French (except Basque)
1
. . . . . . . . . . . . . . . . . . . . . .
185
4.7
French Canadian
1
. . . . . . . . . . . . . . . . . . . . . . . . . . . .
17
0.4
German . . . . . . . . . . . . . . . . . . . . . . . . . . . . . . . . . . . . .
697
17.6
Greek. . . . . . . . . . . . . . . . . . . . . . . . . . . . . . . . . . . . . . .
8
0.2
Hungarian . . . . . . . . . . . . . . . . . . . . . . . . . . . . . . . . . . .
8
0.2
Irish
1
. . . . . . . . . . . . . . . . . . . . . . . . . . . . . . . . . . . . . . . .
476
12.0
Italian . . . . . . . . . . . . . . . . . . . . . . . . . . . . . . . . . . . . . . .
75
1.9
Lithuanian . . . . . . . . . . . . . . . . . . . . . . . . . . . . . . . . . . .
-
-
Norwegian. . . . . . . . . . . . . . . . . . . . . . . . . . . . . . . . . . .
23
0.6
Polish. . . . . . . . . . . . . . . . . . . . . . . . . . . . . . . . . . . . . . .
127
3.2
Portuguese . . . . . . . . . . . . . . . . . . . . . . . . . . . . . . . . . .
6
0.2
Russian . . . . . . . . . . . . . . . . . . . . . . . . . . . . . . . . . . . . .
-
-
Scotch-Irish. . . . . . . . . . . . . . . . . . . . . . . . . . . . . . . . . .
34
0.9
Scottish . . . . . . . . . . . . . . . . . . . . . . . . . . . . . . . . . . . . .
53
1.3
Slovak . . . . . . . . . . . . . . . . . . . . . . . . . . . . . . . . . . . . . .
7
0.2
Subsaharan African. . . . . . . . . . . . . . . . . . . . . . . . . . .
23
0.6
Swedish. . . . . . . . . . . . . . . . . . . . . . . . . . . . . . . . . . . . .
23
0.6
Swiss . . . . . . . . . . . . . . . . . . . . . . . . . . . . . . . . . . . . . . .
-
-
Ukrainian. . . . . . . . . . . . . . . . . . . . . . . . . . . . . . . . . . . .
-
-
United States or American. . . . . . . . . . . . . . . . . . . . .
469
11.9
Welsh. . . . . . . . . . . . . . . . . . . . . . . . . . . . . . . . . . . . . . .
33
0.8
West Indian (excluding Hispanic groups) . . . . . . . .
18
0.5
Other ancestries . . . . . . . . . . . . . . . . . . . . . . . . . . . . .
616
15.6
-Represents zero or rounds to zero. (X) Not applicable.
1
The data represent a combination of two ancestries shown separately in Summary File 3. Czech includes Czechoslovakian. French includes Alsa-
tian. French Canadian includes Acadian/Cajun. Irish includes Celtic.
Source: U.S. Bureau of the Census, Census 2000.
U.S. Census Bureau
2

Page 3
Table DP-3. Profile of Selected Economic Characteristics: 2000
Geographic area: Hollister city, Missouri
[Data based on a sample. For information on confidentiality protection, sampling error, nonsampling error, and definitions, see text]
Subject
Number Percent
EMPLOYMENT STATUS
Population 16 years and over . . . . . . . . . . . .
3,138
100.0
In labor force . . . . . . . . . . . . . . . . . . . . . . . . . . . . . . . .
2,185
69.6
Civilian labor force. . . . . . . . . . . . . . . . . . . . . . . . . .
2,179
69.4
Employed . . . . . . . . . . . . . . . . . . . . . . . . . . . . . . .
1,925
61.3
Unemployed . . . . . . . . . . . . . . . . . . . . . . . . . . . . .
254
8.1
Percent of civilian labor force . . . . . . . . . . . .
11.7
(X)
Armed Forces. . . . . . . . . . . . . . . . . . . . . . . . . . . . . .
6
0.2
Not in labor force. . . . . . . . . . . . . . . . . . . . . . . . . . . . .
953
30.4
Females 16 years and over . . . . . . . . . . . . . .
1,660
100.0
In labor force . . . . . . . . . . . . . . . . . . . . . . . . . . . . . . . .
1,073
64.6
Civilian labor force. . . . . . . . . . . . . . . . . . . . . . . . . .
1,073
64.6
Employed . . . . . . . . . . . . . . . . . . . . . . . . . . . . . . .
916
55.2
Own children under 6 years. . . . . . . . . . . . . .
346
100.0
All parents in family in labor force . . . . . . . . . . . . . .
241
69.7
COMMUTING TO WORK
Workers 16 years and over . . . . . . . . . . . . . .
1,881
100.0
Car, truck, or van - - drove alone. . . . . . . . . . . . . . .
1,536
81.7
Car, truck, or van - - carpooled. . . . . . . . . . . . . . . . .
259
13.8
Public transportation (including taxicab) . . . . . . . . .
-
-
Walked. . . . . . . . . . . . . . . . . . . . . . . . . . . . . . . . . . . . . .
31
1.6
Other means. . . . . . . . . . . . . . . . . . . . . . . . . . . . . . . . .
21
1.1
Worked at home . . . . . . . . . . . . . . . . . . . . . . . . . . . . .
34
1.8
Mean travel time to work (minutes)
1
. . . . . . . . . . . .
18.5
(X)
Employed civilian population
16 years and over . . . . . . . . . . . . . . . . . . . . .
1,925
100.0
OCCUPATION
Management, professional, and related
occupations . . . . . . . . . . . . . . . . . . . . . . . . . . . . . . . .
414
21.5
Service occupations . . . . . . . . . . . . . . . . . . . . . . . . . .
536
27.8
Sales and office occupations . . . . . . . . . . . . . . . . . .
639
33.2
Farming, fishing, and forestry occupations. . . . . . .
-
-
Construction, extraction, and maintenance
occupations . . . . . . . . . . . . . . . . . . . . . . . . . . . . . . . .
120
6.2
Production, transportation, and material moving
occupations . . . . . . . . . . . . . . . . . . . . . . . . . . . . . . . .
216
11.2
INDUSTRY
Agriculture, forestry, fishing and hunting,
and mining . . . . . . . . . . . . . . . . . . . . . . . . . . . . . . . . .
-
-
Construction . . . . . . . . . . . . . . . . . . . . . . . . . . . . . . . . .
84
4.4
Manufacturing. . . . . . . . . . . . . . . . . . . . . . . . . . . . . . . .
122
6.3
Wholesale trade. . . . . . . . . . . . . . . . . . . . . . . . . . . . . .
14
0.7
Retail trade . . . . . . . . . . . . . . . . . . . . . . . . . . . . . . . . . .
369
19.2
Transportation and warehousing, and utilities . . . .
61
3.2
Information . . . . . . . . . . . . . . . . . . . . . . . . . . . . . . . . . .
40
2.1
Finance, insurance, real estate, and rental and
leasing. . . . . . . . . . . . . . . . . . . . . . . . . . . . . . . . . . . . .
123
6.4
Professional, scientific, management, adminis-
trative, and waste management services . . . . . . .
131
6.8
Educational, health and social services . . . . . . . . .
249
12.9
Arts, entertainment, recreation, accommodation
and food services . . . . . . . . . . . . . . . . . . . . . . . . . . .
639
33.2
Other services (except public administration) . . . .
69
3.6
Public administration. . . . . . . . . . . . . . . . . . . . . . . . . .
24
1.2
CLASS OF WORKER
Private wage and salary workers . . . . . . . . . . . . . . .
1,676
87.1
Government workers. . . . . . . . . . . . . . . . . . . . . . . . . .
104
5.4
Self-employed workers in own not incorporated
business . . . . . . . . . . . . . . . . . . . . . . . . . . . . . . . . . . .
145
7.5
Unpaid family workers . . . . . . . . . . . . . . . . . . . . . . . .
-
-
Subject
Number Percent
INCOME IN 1999
Households. . . . . . . . . . . . . . . . . . . . . . . . . . . . .
1,666
100.0
Less than $10,000. . . . . . . . . . . . . . . . . . . . . . . . . . . .
202
12.1
$10,000 to $14,999. . . . . . . . . . . . . . . . . . . . . . . . . . .
222
13.3
$15,000 to $24,999. . . . . . . . . . . . . . . . . . . . . . . . . . .
430
25.8
$25,000 to $34,999. . . . . . . . . . . . . . . . . . . . . . . . . . .
338
20.3
$35,000 to $49,999. . . . . . . . . . . . . . . . . . . . . . . . . . .
231
13.9
$50,000 to $74,999. . . . . . . . . . . . . . . . . . . . . . . . . . .
221
13.3
$75,000 to $99,999. . . . . . . . . . . . . . . . . . . . . . . . . . .
6
0.4
$100,000 to $149,999. . . . . . . . . . . . . . . . . . . . . . . . .
16
1.0
$150,000 to $199,999. . . . . . . . . . . . . . . . . . . . . . . . .
-
-
$200,000 or more . . . . . . . . . . . . . . . . . . . . . . . . . . . .
-
-
Median household income (dollars). . . . . . . . . . . . .
24,535
(X)
With earnings . . . . . . . . . . . . . . . . . . . . . . . . . . . . . . . .
1,408
84.5
Mean earnings (dollars)
1
. . . . . . . . . . . . . . . . . . . .
26,560
(X)
With Social Security income . . . . . . . . . . . . . . . . . . .
384
23.0
Mean Social Security income (dollars)
1
. . . . . . .
10,263
(X)
With Supplemental Security Income . . . . . . . . . . . .
50
3.0
Mean Supplemental Security Income
(dollars)
1
. . . . . . . . . . . . . . . . . . . . . . . . . . . . . . . . .
5,066
(X)
With public assistance income . . . . . . . . . . . . . . . . .
64
3.8
Mean public assistance income (dollars)
1
. . . . .
1,940
(X)
With retirement income . . . . . . . . . . . . . . . . . . . . . . .
295
17.7
Mean retirement income (dollars)
1
. . . . . . . . . . . .
10,921
(X)
Families . . . . . . . . . . . . . . . . . . . . . . . . . . . . . . . .
1,018
100.0
Less than $10,000. . . . . . . . . . . . . . . . . . . . . . . . . . . .
55
5.4
$10,000 to $14,999. . . . . . . . . . . . . . . . . . . . . . . . . . .
90
8.8
$15,000 to $24,999. . . . . . . . . . . . . . . . . . . . . . . . . . .
251
24.7
$25,000 to $34,999. . . . . . . . . . . . . . . . . . . . . . . . . . .
225
22.1
$35,000 to $49,999. . . . . . . . . . . . . . . . . . . . . . . . . . .
200
19.6
$50,000 to $74,999. . . . . . . . . . . . . . . . . . . . . . . . . . .
189
18.6
$75,000 to $99,999. . . . . . . . . . . . . . . . . . . . . . . . . . .
-
-
$100,000 to $149,999. . . . . . . . . . . . . . . . . . . . . . . . .
8
0.8
$150,000 to $199,999. . . . . . . . . . . . . . . . . . . . . . . . .
-
-
$200,000 or more . . . . . . . . . . . . . . . . . . . . . . . . . . . .
-
-
Median family income (dollars). . . . . . . . . . . . . . . . .
30,433
(X)
Per capita income (dollars)
1
. . . . . . . . . . . . . . . . . . .
12,716
(X)
Median earnings (dollars):
Male full-time, year-round workers. . . . . . . . . . . . . .
20,748
(X)
Female full-time, year-round workers . . . . . . . . . . .
18,274
(X)
Subject
Number
below
poverty
level
Percent
below
poverty
level
POVERTY STATUS IN 1999
Families . . . . . . . . . . . . . . . . . . . . . . . . . . . . . . . .
108
10.6
With related children under 18 years. . . . . . . . . . . .
84
17.0
With related children under 5 years. . . . . . . . . . .
39
19.2
Families with female householder, no
husband present . . . . . . . . . . . . . . . . . . . . . . .
57
26.9
With related children under 18 years. . . . . . . . . . . .
57
38.3
With related children under 5 years. . . . . . . . . . .
21
48.8
Individuals. . . . . . . . . . . . . . . . . . . . . . . . . . . . . .
501
13.2
18 years and over . . . . . . . . . . . . . . . . . . . . . . . . . . . .
327
11.5
65 years and over . . . . . . . . . . . . . . . . . . . . . . . . . .
29
7.8
Related children under 18 years . . . . . . . . . . . . . . .
163
17.6
Related children 5 to 17 years . . . . . . . . . . . . . . .
117
18.1
Unrelated individuals 15 years and over. . . . . . . . .
185
21.2
-Represents zero or rounds to zero. (X) Not applicable.
1
If the denominator of a mean value or per capita value is less than 30, then that value is calculated using a rounded aggregate in the numerator.
See text.
Source: U.S. Bureau of the Census, Census 2000.
U.S. Census Bureau
3

Page 4
Table DP-4. Profile of Selected Housing Characteristics: 2000
Geographic area: Hollister city, Missouri
[Data based on a sample. For information on confidentiality protection, sampling error, nonsampling error, and definitions, see text]
Subject
Number Percent
Total housing units. . . . . . . . . . . . . . . . . . . .
1,958
100.0
UNITS IN STRUCTURE
1-unit, detached. . . . . . . . . . . . . . . . . . . . . . . . . . . . . .
698
35.6
1-unit, attached . . . . . . . . . . . . . . . . . . . . . . . . . . . . . .
50
2.6
2 units . . . . . . . . . . . . . . . . . . . . . . . . . . . . . . . . . . . . . .
59
3.0
3 or 4 units . . . . . . . . . . . . . . . . . . . . . . . . . . . . . . . . . .
67
3.4
5 to 9 units . . . . . . . . . . . . . . . . . . . . . . . . . . . . . . . . . .
86
4.4
10 to 19 units . . . . . . . . . . . . . . . . . . . . . . . . . . . . . . . .
280
14.3
20 or more units . . . . . . . . . . . . . . . . . . . . . . . . . . . . .
203
10.4
Mobile home. . . . . . . . . . . . . . . . . . . . . . . . . . . . . . . . .
506
25.8
Boat, RV, van, etc . . . . . . . . . . . . . . . . . . . . . . . . . . . .
9
0.5
YEAR STRUCTURE BUILT
1999 to March 2000 . . . . . . . . . . . . . . . . . . . . . . . . . .
63
3.2
1995 to 1998 . . . . . . . . . . . . . . . . . . . . . . . . . . . . . . . .
275
14.0
1990 to 1994 . . . . . . . . . . . . . . . . . . . . . . . . . . . . . . . .
487
24.9
1980 to 1989 . . . . . . . . . . . . . . . . . . . . . . . . . . . . . . . .
347
17.7
1970 to 1979 . . . . . . . . . . . . . . . . . . . . . . . . . . . . . . . .
327
16.7
1960 to 1969 . . . . . . . . . . . . . . . . . . . . . . . . . . . . . . . .
235
12.0
1940 to 1959 . . . . . . . . . . . . . . . . . . . . . . . . . . . . . . . .
147
7.5
1939 or earlier . . . . . . . . . . . . . . . . . . . . . . . . . . . . . . .
77
3.9
ROOMS
1 room . . . . . . . . . . . . . . . . . . . . . . . . . . . . . . . . . . . . . .
66
3.4
2 rooms . . . . . . . . . . . . . . . . . . . . . . . . . . . . . . . . . . . . .
136
6.9
3 rooms . . . . . . . . . . . . . . . . . . . . . . . . . . . . . . . . . . . . .
247
12.6
4 rooms . . . . . . . . . . . . . . . . . . . . . . . . . . . . . . . . . . . . .
552
28.2
5 rooms . . . . . . . . . . . . . . . . . . . . . . . . . . . . . . . . . . . . .
555
28.3
6 rooms . . . . . . . . . . . . . . . . . . . . . . . . . . . . . . . . . . . . .
190
9.7
7 rooms . . . . . . . . . . . . . . . . . . . . . . . . . . . . . . . . . . . . .
103
5.3
8 rooms . . . . . . . . . . . . . . . . . . . . . . . . . . . . . . . . . . . . .
56
2.9
9 or more rooms . . . . . . . . . . . . . . . . . . . . . . . . . . . . .
53
2.7
Median (rooms) . . . . . . . . . . . . . . . . . . . . . . . . . . . . . .
4.5
(X)
Occupied housing units . . . . . . . . . . . . . . .
1,715
100.0
YEAR HOUSEHOLDER MOVED INTO UNIT
1999 to March 2000 . . . . . . . . . . . . . . . . . . . . . . . . . .
601
35.0
1995 to 1998 . . . . . . . . . . . . . . . . . . . . . . . . . . . . . . . .
572
33.4
1990 to 1994 . . . . . . . . . . . . . . . . . . . . . . . . . . . . . . . .
303
17.7
1980 to 1989 . . . . . . . . . . . . . . . . . . . . . . . . . . . . . . . .
130
7.6
1970 to 1979 . . . . . . . . . . . . . . . . . . . . . . . . . . . . . . . .
76
4.4
1969 or earlier . . . . . . . . . . . . . . . . . . . . . . . . . . . . . . .
33
1.9
VEHICLES AVAILABLE
None . . . . . . . . . . . . . . . . . . . . . . . . . . . . . . . . . . . . . . .
105
6.1
1 . . . . . . . . . . . . . . . . . . . . . . . . . . . . . . . . . . . . . . . . . . .
759
44.3
2 . . . . . . . . . . . . . . . . . . . . . . . . . . . . . . . . . . . . . . . . . . .
655
38.2
3 or more . . . . . . . . . . . . . . . . . . . . . . . . . . . . . . . . . . .
196
11.4
HOUSE HEATING FUEL
Utility gas . . . . . . . . . . . . . . . . . . . . . . . . . . . . . . . . . . .
58
3.4
Bottled, tank, or LP gas . . . . . . . . . . . . . . . . . . . . . . .
272
15.9
Electricity. . . . . . . . . . . . . . . . . . . . . . . . . . . . . . . . . . . .
1,315
76.7
Fuel oil, kerosene, etc . . . . . . . . . . . . . . . . . . . . . . . .
19
1.1
Coal or coke. . . . . . . . . . . . . . . . . . . . . . . . . . . . . . . . .
-
-
Wood . . . . . . . . . . . . . . . . . . . . . . . . . . . . . . . . . . . . . . .
30
1.7
Solar energy. . . . . . . . . . . . . . . . . . . . . . . . . . . . . . . . .
-
-
Other fuel . . . . . . . . . . . . . . . . . . . . . . . . . . . . . . . . . . .
9
0.5
No fuel used. . . . . . . . . . . . . . . . . . . . . . . . . . . . . . . . .
12
0.7
SELECTED CHARACTERISTICS
Lacking complete plumbing facilities . . . . . . . . . . . .
-
-
Lacking complete kitchen facilities. . . . . . . . . . . . . .
20
1.2
No telephone service . . . . . . . . . . . . . . . . . . . . . . . . .
100
5.8
Subject
Number Percent
OCCUPANTS PER ROOM
Occupied housing units . . . . . . . . . . . . . . .
1,715
100.0
1.00 or less. . . . . . . . . . . . . . . . . . . . . . . . . . . . . . . . . .
1,622
94.6
1.01 to 1.50 . . . . . . . . . . . . . . . . . . . . . . . . . . . . . . . . .
59
3.4
1.51 or more. . . . . . . . . . . . . . . . . . . . . . . . . . . . . . . . .
34
2.0
Specified owner-occupied units . . . . . . . .
504
100.0
VALUE
Less than $50,000. . . . . . . . . . . . . . . . . . . . . . . . . . . .
99
19.6
$50,000 to $99,999. . . . . . . . . . . . . . . . . . . . . . . . . . .
326
64.7
$100,000 to $149,999. . . . . . . . . . . . . . . . . . . . . . . . .
37
7.3
$150,000 to $199,999. . . . . . . . . . . . . . . . . . . . . . . . .
28
5.6
$200,000 to $299,999. . . . . . . . . . . . . . . . . . . . . . . . .
14
2.8
$300,000 to $499,999. . . . . . . . . . . . . . . . . . . . . . . . .
-
-
$500,000 to $999,999. . . . . . . . . . . . . . . . . . . . . . . . .
-
-
$1,000,000 or more. . . . . . . . . . . . . . . . . . . . . . . . . . .
-
-
Median (dollars). . . . . . . . . . . . . . . . . . . . . . . . . . . . . .
74,500
(X)
MORTGAGE STATUS AND SELECTED
MONTHLY OWNER COSTS
With a mortgage . . . . . . . . . . . . . . . . . . . . . . . . . . . . .
348
69.0
Less than $300 . . . . . . . . . . . . . . . . . . . . . . . . . .
16
3.2
$300 to $499 . . . . . . . . . . . . . . . . . . . . . . . . . . . .
90
17.9
$500 to $699 . . . . . . . . . . . . . . . . . . . . . . . . . . . .
126
25.0
$700 to $999 . . . . . . . . . . . . . . . . . . . . . . . . . . . .
64
12.7
$1,000 to $1,499 . . . . . . . . . . . . . . . . . . . . . . . . .
47
9.3
$1,500 to $1,999 . . . . . . . . . . . . . . . . . . . . . . . . .
5
1.0
$2,000 or more . . . . . . . . . . . . . . . . . . . . . . . . . .
-
-
Median (dollars). . . . . . . . . . . . . . . . . . . . . . . . . .
628
(X)
Not mortgaged . . . . . . . . . . . . . . . . . . . . . . . . . . . . . . .
156
31.0
Median (dollars). . . . . . . . . . . . . . . . . . . . . . . . . .
215
(X)
SELECTED MONTHLY OWNER COSTS
AS A PERCENTAGE OF HOUSEHOLD
INCOME IN 1999
Less than 15.0 percent. . . . . . . . . . . . . . . . . . . . . . . .
164
32.5
15.0 to 19.9 percent . . . . . . . . . . . . . . . . . . . . . . . . . .
108
21.4
20.0 to 24.9 percent . . . . . . . . . . . . . . . . . . . . . . . . . .
52
10.3
25.0 to 29.9 percent . . . . . . . . . . . . . . . . . . . . . . . . . .
43
8.5
30.0 to 34.9 percent . . . . . . . . . . . . . . . . . . . . . . . . . .
48
9.5
35.0 percent or more . . . . . . . . . . . . . . . . . . . . . . . . .
57
11.3
Not computed. . . . . . . . . . . . . . . . . . . . . . . . . . . . . . . .
32
6.3
Specified renter-occupied units . . . . . . . .
811
100.0
GROSS RENT
Less than $200 . . . . . . . . . . . . . . . . . . . . . . . . . . . . . .
43
5.3
$200 to $299 . . . . . . . . . . . . . . . . . . . . . . . . . . . . . . . .
91
11.2
$300 to $499 . . . . . . . . . . . . . . . . . . . . . . . . . . . . . . . .
311
38.3
$500 to $749 . . . . . . . . . . . . . . . . . . . . . . . . . . . . . . . .
295
36.4
$750 to $999 . . . . . . . . . . . . . . . . . . . . . . . . . . . . . . . .
21
2.6
$1,000 to $1,499 . . . . . . . . . . . . . . . . . . . . . . . . . . . . .
-
-
$1,500 or more . . . . . . . . . . . . . . . . . . . . . . . . . . . . . .
-
-
No cash rent. . . . . . . . . . . . . . . . . . . . . . . . . . . . . . . . .
50
6.2
Median (dollars). . . . . . . . . . . . . . . . . . . . . . . . . . . . . .
456
(X)
GROSS RENT AS A PERCENTAGE OF
HOUSEHOLD INCOME IN 1999
Less than 15.0 percent. . . . . . . . . . . . . . . . . . . . . . . .
149
18.4
15.0 to 19.9 percent . . . . . . . . . . . . . . . . . . . . . . . . . .
115
14.2
20.0 to 24.9 percent . . . . . . . . . . . . . . . . . . . . . . . . . .
162
20.0
25.0 to 29.9 percent . . . . . . . . . . . . . . . . . . . . . . . . . .
81
10.0